
3. 실습: API Server k6 활용
2.5.에서 기본적인 k6의 문법을 학습하고 임의의 사이트(https://quickpizza.grafana.com)에 접속을 요청하는 테스트를 실습하였다. 실제로 실무에서는 자신의 애플리케이션의 요청에 대한 테스트를 해야한다.
3.1. API Server 구축
3.1.1. 프로젝트 요약
name: step03_app_test
Group: step03_app_test
Package: io.test
dependency
- lombok
- DevTools
- Spring Web
- Spring Data Redis
- MySQL Driver
- Spring Data JPA
3.1.2. pom.xml
<?xml version="1.0" encoding="UTF-8"?>
<project xmlns="http://maven.apache.org/POM/4.0.0" xmlns:xsi="http://www.w3.org/2001/XMLSchema-instance"
         xsi:schemaLocation="http://maven.apache.org/POM/4.0.0 https://maven.apache.org/xsd/maven-4.0.0.xsd">
    <modelVersion>4.0.0</modelVersion>
    <parent>
        <groupId>org.springframework.boot</groupId>
        <artifactId>spring-boot-starter-parent</artifactId>
        <version>3.5.3</version>
        <relativePath/> <!-- lookup parent from repository -->
    </parent>
    <groupId>step03_app_test</groupId>
    <artifactId>step03_app_test</artifactId>
    <version>0.0.1-SNAPSHOT</version>
    <name>step03_app_test</name>
    <description>step03_app_test</description>
    <url/>
    <licenses>
        <license/>
    </licenses>
    <developers>
        <developer/>
    </developers>
    <scm>
        <connection/>
        <developerConnection/>
        <tag/>
        <url/>
    </scm>
    <properties>
        <java.version>17</java.version>
    </properties>
    <dependencies>
        <dependency>
            <groupId>org.springframework.boot</groupId>
            <artifactId>spring-boot-starter-data-jpa</artifactId>
        </dependency>
        <dependency>
            <groupId>org.springframework.boot</groupId>
            <artifactId>spring-boot-starter-data-redis</artifactId>
        </dependency>
        <dependency>
            <groupId>org.springframework.boot</groupId>
            <artifactId>spring-boot-starter-web</artifactId>
        </dependency>

        <dependency>
            <groupId>com.mysql</groupId>
            <artifactId>mysql-connector-j</artifactId>
            <scope>runtime</scope>
        </dependency>
        <dependency>
            <groupId>org.projectlombok</groupId>
            <artifactId>lombok</artifactId>
            <version>1.18.34</version>
            <optional>true</optional>
        </dependency>
        <dependency>
            <groupId>org.springframework.boot</groupId>
            <artifactId>spring-boot-starter-test</artifactId>
            <scope>test</scope>
        </dependency>
    </dependencies>

    <build>
        <plugins>
            <plugin>
                <groupId>org.apache.maven.plugins</groupId>
                <artifactId>maven-compiler-plugin</artifactId>
                <configuration>
                    <annotationProcessorPaths>
                        <path>
                            <groupId>org.projectlombok</groupId>
                            <artifactId>lombok</artifactId>
                            <version>1.18.34</version>
                        </path>
                    </annotationProcessorPaths>
                </configuration>
            </plugin>
            <plugin>
                <groupId>org.springframework.boot</groupId>
                <artifactId>spring-boot-maven-plugin</artifactId>
                <configuration>
                    <excludes>
                        <exclude>
                            <groupId>org.projectlombok</groupId>
                            <artifactId>lombok</artifactId>
                        </exclude>
                    </excludes>
                </configuration>
            </plugin>
        </plugins>
    </build>

</project>
3.1.3. application.properties
spring.application.name=step03_app_test

server.address=0.0.0.0

# Server Configuration
server.port=8083

# Redis Configuration
spring.data.redis.host=127.0.0.1
spring.data.redis.client-name=default
spring.data.redis.password=redis1234
spring.data.redis.port=6379
spring.data.redis.timeout=2000
spring.data.redis.lettuce.pool.max-active=8
spring.data.redis.lettuce.pool.max-idle=8
spring.data.redis.lettuce.pool.min-idle=0
spring.data.redis.lettuce.pool.max-wait=-1

# Datasource
spring.datasource.url=jdbc:mysql://127.0.0.1:3307/testdb?useSSL=false&serverTimezone=Asia/Seoul
spring.datasource.username=testuser
spring.datasource.password=testpass
spring.datasource.hikari.maximum-pool-size=20
spring.datasource.hikari.minimum-idle=10
spring.datasource.hikari.connection-timeout=30000
spring.datasource.hikari.idle-timeout=600000
spring.datasource.hikari.max-lifetime=1800000

# JPA / Hibernate
spring.jpa.hibernate.ddl-auto=update
spring.jpa.properties.hibernate.dialect=org.hibernate.dialect.MySQL8Dialect
spring.jpa.properties.hibernate.format_sql=true
spring.jpa.show-sql=true
logging.level.org.hibernate.SQL=DEBUG
3.1.4. Entity
io/test/entity/User.java
@Entity
@Data
@NoArgsConstructor
@AllArgsConstructor
@Builder
public class User {

    @Id
    @GeneratedValue(strategy = GenerationType.IDENTITY)
    private Long id;

    private String name;

    private String email;

    private Integer age;
}
3.1.5. Configuration
io/test/config/RedisConfig.java
@Configuration
public class RedisConfig {

    @Bean
    public LettuceConnectionFactory redisConnectionFactory() {
        return new LettuceConnectionFactory();
    }

    @Bean
    public RedisTemplate<String, Object> redisTemplate(LettuceConnectionFactory connectionFactory) {
        RedisTemplate<String, Object> template = new RedisTemplate<>();
        template.setConnectionFactory(connectionFactory);
        template.setKeySerializer(new StringRedisSerializer());
        template.setValueSerializer(new GenericJackson2JsonRedisSerializer());
        template.setHashKeySerializer(new StringRedisSerializer());
        template.setHashValueSerializer(new GenericJackson2JsonRedisSerializer());
        return template;
    }

}
3.1.6. Repository
io/test/repository/UserRepository.java
3.1.7. Service
io/test/service/UserService.java
@Service
@RequiredArgsConstructor
public class UserService {

    private final UserRepository userRepository;

    @Transactional
    public void initUsers() {
    	if (userRepository.count() == 0) {
            IntStream.rangeClosed(1, 1000).forEach(i -> {
                userRepository.save(User.builder()
                        .name("User" + i)
                        .email("user" + i + "@test.com")
                        .age(20 + (i % 30))
                        .build());
            });
    	}
    }

    @Transactional
    public User findById(Long id) {
        return userRepository.findById(id).orElse(null);
    }

    @Transactional
    public List<User> createBulk(List<User> users) {
        return userRepository.saveAll(users);
    }
}
3.1.8. Controller
io/test/controller/UserTestController.java
@RestController
@RequestMapping("/api")
@RequiredArgsConstructor
public class UserTestController {
private final UserService userService;
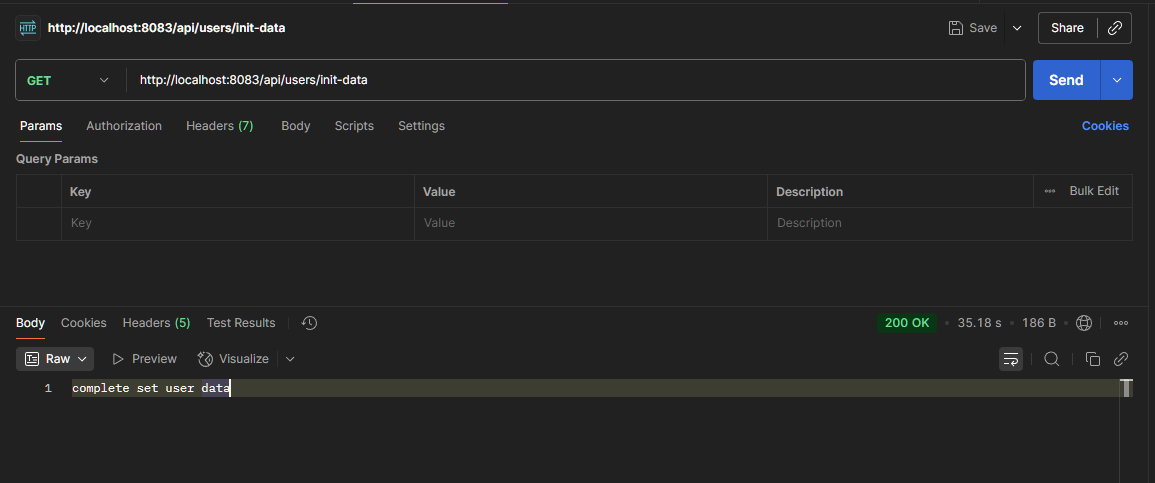
// 초기 데이터 세팅
@GetMapping("/users/init-data")
public ResponseEntity<String> initUsers() {
userService.initUsers();
return ResponseEntity.ok("complete set user data");
}
// 단일 사용자 조회 API
@GetMapping("/users/{id}")
public ResponseEntity<User> getUser(@PathVariable Long id) {
User user = userService.findById(id);
if (user == null) {
return ResponseEntity.notFound().build();
}
return ResponseEntity.ok(user);
}
// CPU 과부화 API
@GetMapping("/calculate")
public ResponseEntity<Map<String, Object>> calculate(@RequestParam int complexity) {
long start = System.currentTimeMillis();
double result = 0;
for (int i = 0; i < complexity * 1_000_000; i++) {
result += Math.sqrt(i) * Math.sin(i);
}
long duration = System.currentTimeMillis() - start;
Map<String, Object> response = new HashMap<>();
response.put("result", result);
response.put("processingTimeMs", duration);
return ResponseEntity.ok(response);
}
// 대량 사용자 생성 API
@PostMapping("/users/bulk")
public ResponseEntity<List<User>> createBulkUsers(@RequestBody List<User> users) {
List<User> created = userService.createBulk(users);
return ResponseEntity.ok(created);
}
// 헬스 체크
@GetMapping("/health")
public ResponseEntity<Map<String, String>> health() {
return ResponseEntity.ok(Map.of("status", "UP"));
}
}3.2. 기본 성능 테스트
3.2.1. 테스트 단계별 실행
[1] 데이터 세팅
GET | http://localhost:8083/api/users/init-data

[2] 테스트 스크립트 작성
vi get-user-script.jsimport http from 'k6/http';
import { check, sleep } from 'k6';
// 테스트 설정
export let options = {
vus: 10, // 가상 사용자 수
duration: '30s', // 테스트 지속 시간
};
// 초기화 코드 (1회 실행)
export function setup() {
console.log('테스트 시작');
return { testData: 'some data' };
}
// 메인 테스트 함수 (각 VU가 반복 실행)
export default function (data) {
let response = http.get('http://127.0.0.1:8080/api/users/1');
check(response, {
'status is 200': (r) => r.status === 200,
'response time < 500ms': (r) => r.timings.duration < 500,
});
// sleep(1);
}
// 정리 코드 (1회 실행)
export function teardown(data) {
console.log('테스트 종료');
}
[3] 실행 결과 확인
k6 run get-user-script.jsubuntu@ubuntu:~/k6$ k6 run get-user-script.js
/\ Grafana /‾‾/
/\ / \ |\ __ / /
/ \/ \ | |/ / / ‾‾\
/ \ | ( | (‾) |
/ __________ \ |_|\_\ \_____/
execution: local
script: get-user-script.js
output: -
scenarios: (100.00%) 1 scenario, 10 max VUs, 1m0s max duration (incl. graceful stop):
* default: 10 looping VUs for 30s (gracefulStop: 30s)
INFO[0000] 테스트 시작 source=console
WARN[0000] Request Failed error="Get \"http://127.0.0.1:8080/api/users/1\": dial tcp 127.0.0.1:8080: connect: connection refused"
WARN[0000] Request Failed error="Get \"http://127.0.0.1:8080/api/users/1\": dial tcp 127.0.0.1:8080: connect: connection refused"
WARN[0001] Request Failed error="Get \"http://127.0.0.1:8080/api/users/1\": dial tcp 127.0.0.1:8080: connect: connection refused"
WARN[0000] Request Failed error="Get \"http://127.0.0.1:8080/api/users/1\": dial tcp 127.0.0.1
[4] 트러블 슈팅(포트포워딩 / script 수정)
테스트를 실행해보면 WARN[0000] Request failed라는 메시지와 함께 테스트가 실패한다. 그 이유는 테스트 스크립트에 설정한 http.get()의 내용이 환경과 맞지않아서이다.
테스트 스크립트에 작성한 let response = http.get('http://127.0.0.1:8080/api/users/1');에서 127.0.0.1:8080에 대해 요청하는것은 ubuntu 내부에 있는 스프링 8080 서버한테 요청을 보낸다는 의미이다. 현재 우리는 로컬(Windows11)에서 Spring Boot Server가 실행되기 때문에, 로컬과 ubuntu의 포트를 서로 열여놔서 연동시켜야 한다.
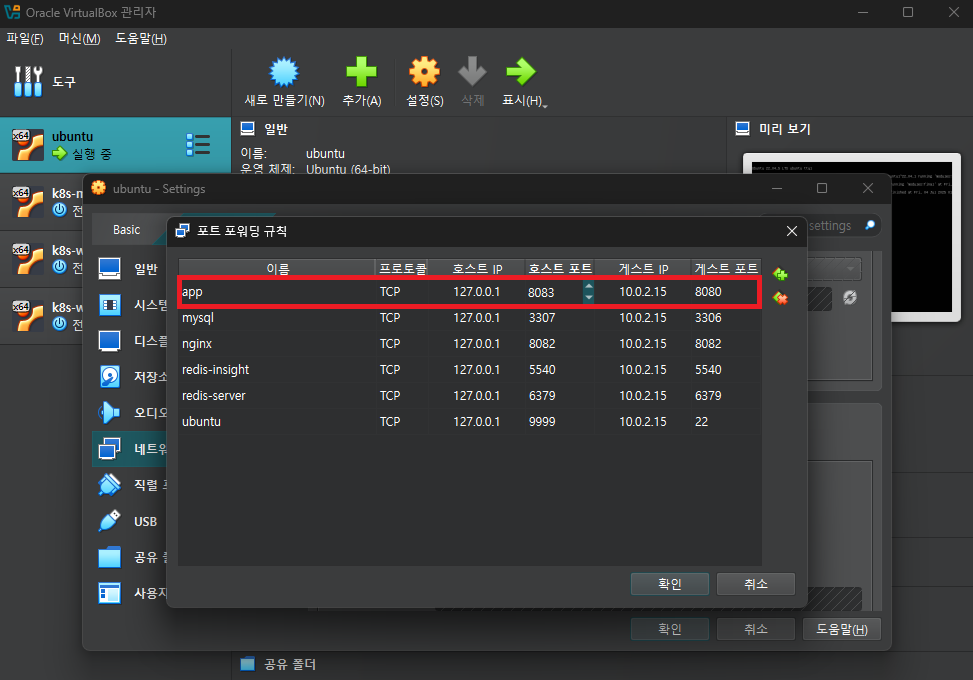
cmd에서 로컬(Windows)에서 ipconfig 해서 로컬 ipv4 주소 얻어온 후, 해당 ipv6를 script의 http.get()으로 설정해야 한다.

vi get-user-script.jsimport http from 'k6/http';
import { check, sleep } from 'k6';
// 테스트 설정
export let options = {
vus: 10, // 가상 사용자 수
duration: '30s', // 테스트 지속 시간
};
// 초기화 코드 (1회 실행)
export function setup() {
console.log('테스트 시작');
return { testData: 'some data' };
}
// 메인 테스트 함수 (각 VU가 반복 실행)
export default function (data) {
let response = http.get('http://192.168.56.1:8083/api/users/1'); # 📌 핵심 변경 사항
check(response, {
'status is 200': (r) => r.status === 200,
'response time < 500ms': (r) => r.timings.duration < 500,
});
// sleep(1);
}
// 정리 코드 (1회 실행)
export function teardown(data) {
console.log('테스트 종료');
}
[5] 테스트 재시작
다시 실행해보면 아래와 같은 결과를 확인할 수 있다.
k6 run get-user-script.jsubuntu@ubuntu:~/k6$ k6 run get-user-script.js
/\ Grafana /‾‾/
/\ / \ |\ __ / /
/ \/ \ | |/ / / ‾‾\
/ \ | ( | (‾) |
/ __________ \ |_|\_\ \_____/
execution: local
script: get-user-script.js
output: -
scenarios: (100.00%) 1 scenario, 10 max VUs, 1m0s max duration (incl. graceful stop):
* default: 10 looping VUs for 30s (gracefulStop: 30s)
INFO[0000] 테스트 시작 source=console
INFO[0030] 테스트 종료 source=console
█ TOTAL RESULTS
checks_total.......................: 3362 111.045995/s
checks_succeeded...................: 98.45% 3310 out of 3362
checks_failed......................: 1.54% 52 out of 3362
✓ status is 200
✗ response time < 500ms
↳ 96% — ✓ 1629 / ✗ 52
HTTP
http_req_duration.......................................................: avg=175.29ms min=26.05ms med=136.8ms max=1.12s p(90)=317.81ms p(95)=423.56ms
{ expected_response:true }............................................: avg=175.29ms min=26.05ms med=136.8ms max=1.12s p(90)=317.81ms p(95)=423.56ms
http_req_failed.........................................................: 0.00% 0 out of 1681
http_reqs...............................................................: 1681 55.522998/s
EXECUTION
iteration_duration......................................................: avg=179.04ms min=26.3ms med=140.27ms max=1.12s p(90)=324.49ms p(95)=428.8ms
iterations..............................................................: 1681 55.522998/s
vus.....................................................................: 10 min=10 max=10
vus_max.................................................................: 10 min=10 max=10
NETWORK
data_received...........................................................: 306 kB 10 kB/s
data_sent...............................................................: 141 kB 4.7 kB/s
running (0m30.3s), 00/10 VUs, 1681 complete and 0 interrupted iterations
default ✓ [======================================] 10 VUs 30s
[6] sleep 주석 해제 후 재시작
이제 script안에 있는 sleep 주석 부분을 해제하여 매 요청마다 1초의 시간동안 sleep을 주도록 설정하고, 재시작해보자.
ubuntu@ubuntu:~/k6$ k6 run get-user-script.js

         /\      Grafana   /‾‾/
    /\  /  \     |\  __   /  /
   /  \/    \    | |/ /  /   ‾‾\
  /          \   |   (  |  (‾)  |
 / __________ \  |_|\_\  \_____/

     execution: local
        script: get-user-script.js
        output: -

     scenarios: (100.00%) 1 scenario, 10 max VUs, 1m0s max duration (incl. graceful stop):
              * default: 10 looping VUs for 30s (gracefulStop: 30s)

INFO[0000] 테스트 시작                                        source=console
INFO[0031] 테스트 종료                                        source=console


  █ TOTAL RESULTS

    checks_total.......................: 564    18.090956/s
    checks_succeeded...................: 99.82% 563 out of 564
    checks_failed......................: 0.17%  1 out of 564

    ✓ status is 200
    ✗ response time < 500ms
      ↳  99% — ✓ 281 / ✗ 1

    HTTP
    http_req_duration.......................................................: avg=82.02ms min=15.87ms med=46.08ms max=520.08ms p(90)=165.73ms p(95)=296.21ms
      { expected_response:true }............................................: avg=82.02ms min=15.87ms med=46.08ms max=520.08ms p(90)=165.73ms p(95)=296.21ms
    http_req_failed.........................................................: 0.00% 0 out of 282
    http_reqs...............................................................: 282   9.045478/s

    EXECUTION
    iteration_duration......................................................: avg=1.09s   min=1.01s   med=1.06s   max=1.54s    p(90)=1.17s    p(95)=1.34s
    iterations..............................................................: 282   9.045478/s
    vus.....................................................................: 8     min=8        max=10
    vus_max.................................................................: 10    min=10       max=10

    NETWORK
    data_received...........................................................: 51 kB 1.6 kB/s
    data_sent...............................................................: 24 kB 760 B/s


running (0m31.2s), 00/10 VUs, 282 complete and 0 interrupted iterations
default ✓ [======================================] 10 VUs  30s
sleep(1)을 주석해제 해놨더니 성공률이 96퍼에서 99로 올라간것을 확인할 수 있다.
[8] vus 100 (부하 상승 후 테스트)
k6 run --vus 100 --duration 30s get-user-script.js
결과
ubuntu@ubuntu:~/k6$ k6 run --vus 100 --duration 30s get-user-script.js

         /\      Grafana   /‾‾/
    /\  /  \     |\  __   /  /
   /  \/    \    | |/ /  /   ‾‾\
  /          \   |   (  |  (‾)  |
 / __________ \  |_|\_\  \_____/

     execution: local
        script: get-user-script.js
        output: -

     scenarios: (100.00%) 1 scenario, 100 max VUs, 1m0s max duration (incl. graceful stop):
              * default: 100 looping VUs for 30s (gracefulStop: 30s)

INFO[0000] 테스트 시작                                        source=console
INFO[0032] 테스트 종료                                        source=console


  █ TOTAL RESULTS

    checks_total.......................: 4728   149.019141/s
    checks_succeeded...................: 94.33% 4460 out of 4728
    checks_failed......................: 5.66%  268 out of 4728

    ✓ status is 200
    ✗ response time < 500ms
      ↳  88% — ✓ 2096 / ✗ 268

    HTTP
    http_req_duration.......................................................: avg=253.99ms min=15.56ms med=140.67ms max=10.78s p(90)=528.94ms p(95)=715.33ms
      { expected_response:true }............................................: avg=253.99ms min=15.56ms med=140.67ms max=10.78s p(90)=528.94ms p(95)=715.33ms
    http_req_failed.........................................................: 0.00%  0 out of 2364
    http_reqs...............................................................: 2364   74.50957/s

    EXECUTION
    iteration_duration......................................................: avg=1.29s    min=1.01s   med=1.15s    max=11.89s p(90)=1.59s    p(95)=1.81s
    iterations..............................................................: 2364   74.50957/s
    vus.....................................................................: 3      min=3         max=100
    vus_max.................................................................: 100    min=100       max=100

    NETWORK
    data_received...........................................................: 430 kB 14 kB/s
    data_sent...............................................................: 199 kB 6.3 kB/s


running (0m31.7s), 000/100 VUs, 2364 complete and 0 interrupted iterations
default ✓ [======================================] 100 VUs  30s
[9] vus 200 (부하 상승 후 테스트)
k6 run --vus 200 --duration 30s get-user-script.js
결과
ubuntu@ubuntu:~/k6$ k6 run --vus 200 --duration 30s get-user-script.js

         /\      Grafana   /‾‾/
    /\  /  \     |\  __   /  /
   /  \/    \    | |/ /  /   ‾‾\
  /          \   |   (  |  (‾)  |
 / __________ \  |_|\_\  \_____/

     execution: local
        script: get-user-script.js
        output: -

     scenarios: (100.00%) 1 scenario, 200 max VUs, 1m0s max duration (incl. graceful stop):
              * default: 200 looping VUs for 30s (gracefulStop: 30s)

INFO[0001] 테스트 시작                                        source=console
INFO[0034] 테스트 종료                                        source=console


  █ TOTAL RESULTS

    checks_total.......................: 4158   124.846026/s
    checks_succeeded...................: 50.52% 2101 out of 4158
    checks_failed......................: 49.47% 2057 out of 4158

    ✓ status is 200
    ✗ response time < 500ms
      ↳  1% — ✓ 22 / ✗ 2057

    HTTP
    http_req_duration.......................................................: avg=1.83s min=91.97ms med=1.79s max=5.09s p(90)=2.85s p(95)=2.99s
      { expected_response:true }............................................: avg=1.83s min=91.97ms med=1.79s max=5.09s p(90)=2.85s p(95)=2.99s
    http_req_failed.........................................................: 0.00%  0 out of 2079
    http_reqs...............................................................: 2079   62.423013/s

    EXECUTION
    iteration_duration......................................................: avg=2.96s min=1.1s    med=2.93s max=6.12s p(90)=3.91s p(95)=4.05s
    iterations..............................................................: 2079   62.423013/s
    vus.....................................................................: 76     min=76        max=200
    vus_max.................................................................: 200    min=200       max=200

    NETWORK
    data_received...........................................................: 378 kB 11 kB/s
    data_sent...............................................................: 175 kB 5.2 kB/s


running (0m33.3s), 000/200 VUs, 2079 complete and 0 interrupted iterations
default ✓ [======================================] 200 VUs  30s
✅ vus 100 vs 200 비교 정리
| 항목 | vus = 100 | vus = 200 | 변화 |
| 평균 응답 시간 | 253ms | 1.83s | ⬆️ 약 7.2배 증가 |
| 응답 p95 | 715ms | 2.99s | ⬆️ 약 4배 증가 |
| 요청 수 | 2364 | 2079 | ⬇️ 약 12% 감소 |
| 응답 SLA 만족 (500ms 미만) | 88% | 1% | ⬇️ 극심한 저하 |
| 실패율 (checks_failed) | 5.66% | 49.47% | ⬆️ 약 9배 상승 |
3.2.2. 테스트 실무 팁 (기준표)
[1] 응답 시간
| 구분 | 평균 응답 시간 | 의미 / 해석 | 실무 평가 |
| 매우 우수 | 0 ~ 100ms | 캐싱 활용, 단순 DB 조회, CPU 연산 없음 | 고성능 API, 사용자 체감 매우 쾌적 |
| 우수 | 100 ~ 300ms | 단일 DB 쿼리 + 단순 비즈니스 로직 | 실무에서 이상적, 문제 없음 |
| 보통 | 300 ~ 500ms | 복수 DB 쿼리, 간단한 연산, 외부 API 포함 | 안정적이지만, 개선 여지 있음 |
| 주의 | 500ms ~ 1초 | 복잡한 비즈니스 로직, 대량 데이터 처리 | 사용자 체감 지연 발생 가능, 튜닝 필요 |
| 문제 | 1초 이상 | 비효율 쿼리, 병목, 과도한 외부 호출 등 | 성능 개선 필요. 구조 재검토 고려 |
[2] Percentile 기준 (p(90), p(95))
- p(90): 전체 요청 중 90%가 이 시간 이내에 응답
- p(95): 전체 요청 중 95%가 이 시간 이내에 응답
→ 성능 품질을 측정할 때 평균보다 더 현실적인 기준
| 지표 | 해석 |
| p(90) ≤ 300ms | 전체 요청의 90%가 매우 빠르게 처리됨 → 우수 |
| p(95) ≤ 400ms | 대부분의 사용자 경험이 준수함 |
| p(95 > 500ms) | 체감 지연을 느끼는 사용자 다수 발생 가능성 → 원인 분석 필요 |
[3] 서비스 유형별 목표 응답 시간
| 서비스 유형 | 목표 응답 시간 | 특징 |
| 검색, 게시글 조회 등 기업 서비스 | 100~300ms | 높은 사용자 경험 요구 |
| 사내 API (관리용 도구) | 200~500ms | 관리자만 사용, 약간의 여유 허용 |
| 외부 API 연동 서비스 | 300~800ms | 외부 대기시간 포함, 타 시스템 영향 |
| CPU 연산, 빅데이터 분석 API | 500ms ~ 수 초 | 연산 복잡도 높음, 비동기 고려 |
| 스트리밍, 실시간 게임 | 50ms 이하 | 즉각 응답 필수, 초저지연 요구 |
3.3. 부하 테스트
[1] 스크립트 수정
vi get-user-overload-script.jsimport http from 'k6/http';
import { check, sleep } from 'k6';
#############################################################
# 주 요 변 경 점 #
export let options = {
stages: [
{ duration: '30s', target: 50 }, // warm-up
{ duration: '30s', target: 100 }, // 부하 증가
{ duration: '30s', target: 200 }, // 피크 부하
{ duration: '30s', target: 300 }, // 한계 테스트
{ duration: '30s', target: 0 }, // cool-down
],
thresholds: {
'http_req_duration': [
'p(90)<1000', // 90%가 1초 이내
'p(95)<2000', // 95%가 2초 이내
],
'http_req_failed': ['rate<0.1'], // 에러율 10% 미만
},
};
#############################################################
// 초기화 코드 (1회 실행)
export function setup() {
console.log('테스트 시작');
return { testData: 'some data' };
}
// 메인 테스트 함수 (각 VU가 반복 실행)
export default function (data) {
let response = http.get('http://192.168.56.1:8083/api/users/1');
check(response, {
'status is 200': (r) => r.status === 200,
'response time < 500ms': (r) => r.timings.duration < 500,
});
sleep(1);
}
// 정리 코드 (1회 실행)
export function teardown(data) {
console.log('테스트 종료');
}
[2] 테스트 실행
k6 run get-user-overload-script.jsubuntu@ubuntu:~/k6$ k6 run get-user-overload-script.js
/\ Grafana /‾‾/
/\ / \ |\ __ / /
/ \/ \ | |/ / / ‾‾\
/ \ | ( | (‾) |
/ __________ \ |_|\_\ \_____/
execution: local
script: get-user-overload-script.js
output: -
scenarios: (100.00%) 1 scenario, 300 max VUs, 3m0s max duration (incl. graceful stop):
* default: Up to 300 looping VUs for 2m30s over 5 stages (gracefulRampDown: 30s, gracefulStop: 30s)
INFO[0000] 테스트 시작 source=console
INFO[0151] 테스트 종료 source=console
█ THRESHOLDS
http_req_duration
✗ 'p(90)<1000' p(90)=3.62s
✗ 'p(95)<2000' p(95)=5.11s
http_req_failed
✓ 'rate<0.1' rate=0.00%
█ TOTAL RESULTS
checks_total.......................: 15566 103.130015/s
checks_succeeded...................: 69.04% 10748 out of 15566
checks_failed......................: 30.95% 4818 out of 15566
✓ status is 200
✗ response time < 500ms
↳ 38% — ✓ 2965 / ✗ 4818
HTTP
http_req_duration.......................................................: avg=1.52s min=13.48ms med=916.25ms max=15.78s p(90)=3.62s p(95)=5.11s
{ expected_response:true }............................................: avg=1.52s min=13.48ms med=916.25ms max=15.78s p(90)=3.62s p(95)=5.11s
http_req_failed.........................................................: 0.00% 0 out of 7783
http_reqs...............................................................: 7783 51.565008/s
EXECUTION
iteration_duration......................................................: avg=2.56s min=1.01s med=1.96s max=16.78s p(90)=4.72s p(95)=6.16s
iterations..............................................................: 7783 51.565008/s
vus.....................................................................: 3 min=1 max=300
vus_max.................................................................: 300 min=300 max=300
NETWORK
data_received...........................................................: 1.4 MB 9.4 kB/s
data_sent...............................................................: 654 kB 4.3 kB/s
running (2m30.9s), 000/300 VUs, 7783 complete and 0 interrupted iterations
default ✓ [======================================] 000/300 VUs 2m30s
ERRO[0152] thresholds on metrics 'http_req_duration' have been crossed
3.4. 스트레스 테스트
export let options = {
  stages: [
    { duration: '2m', target: 200 },   // 빠른 증가
    { duration: '5m', target: 500 },   // 과부하
    { duration: '2m', target: 1000 },  // 극한 부하
    { duration: '5m', target: 1000 },  // 극한 부하 유지
    { duration: '5m', target: 0 },     // 복구
  ],
  thresholds: {
    'http_req_duration': ['p(99)<5000'], // 99%가 5초 이내
  },
};
4. 테스트 환경 변경 및 안정화
기존에는 로컬(Windows11)에서 백엔드 서버를 실행하고 ubuntu에서 포트포워딩으로 연결해 ubuntu에서 k6 테스트를 수행하고 있었다. 하지만 이 방식은 네트워크 지연과 불안정성 문제로 인해 정확한 테스트 결과를 얻기 어렵다는 문제가 있었다. 이에 따라, 백엔드 서버를 k6와 같은 Ubuntu 환경 내에서 직접 실행하도록 변경하여 네트워크 병목 없이 테스트가 가능하도록 환경을 재구성해보자.
4.1. Spring Boot 서버 설정 변경
application.properties
로컬 환경에서는 포트 포워딩을 위해 서버 포트와 MySQL 포트를 변경해 사용했지만, 이제는 같은 VM 내부에서 직접 접근하므로 기본 포트로 설정한다.
spring.application.name=step03_app_test

server.address=0.0.0.0

# Server Configuration
server.port=8080

# Redis Configuration
spring.data.redis.host=127.0.0.1
spring.data.redis.client-name=default
spring.data.redis.password=redis1234
spring.data.redis.port=6379
spring.data.redis.timeout=2000
spring.data.redis.lettuce.pool.max-active=8
spring.data.redis.lettuce.pool.max-idle=8
spring.data.redis.lettuce.pool.min-idle=0
spring.data.redis.lettuce.pool.max-wait=-1

# Datasource
spring.datasource.url=jdbc:mysql://127.0.0.1:3306/testdb?useSSL=false&serverTimezone=Asia/Seoul
spring.datasource.username=testuser
spring.datasource.password=testpass
spring.datasource.hikari.maximum-pool-size=20
spring.datasource.hikari.minimum-idle=10
spring.datasource.hikari.connection-timeout=30000
spring.datasource.hikari.idle-timeout=600000
spring.datasource.hikari.max-lifetime=1800000

# JPA / Hibernate
spring.jpa.hibernate.ddl-auto=update
spring.jpa.properties.hibernate.dialect=org.hibernate.dialect.MySQL8Dialect
spring.jpa.properties.hibernate.format_sql=true
spring.jpa.show-sql=true
logging.level.org.hibernate.SQL=DEBUG
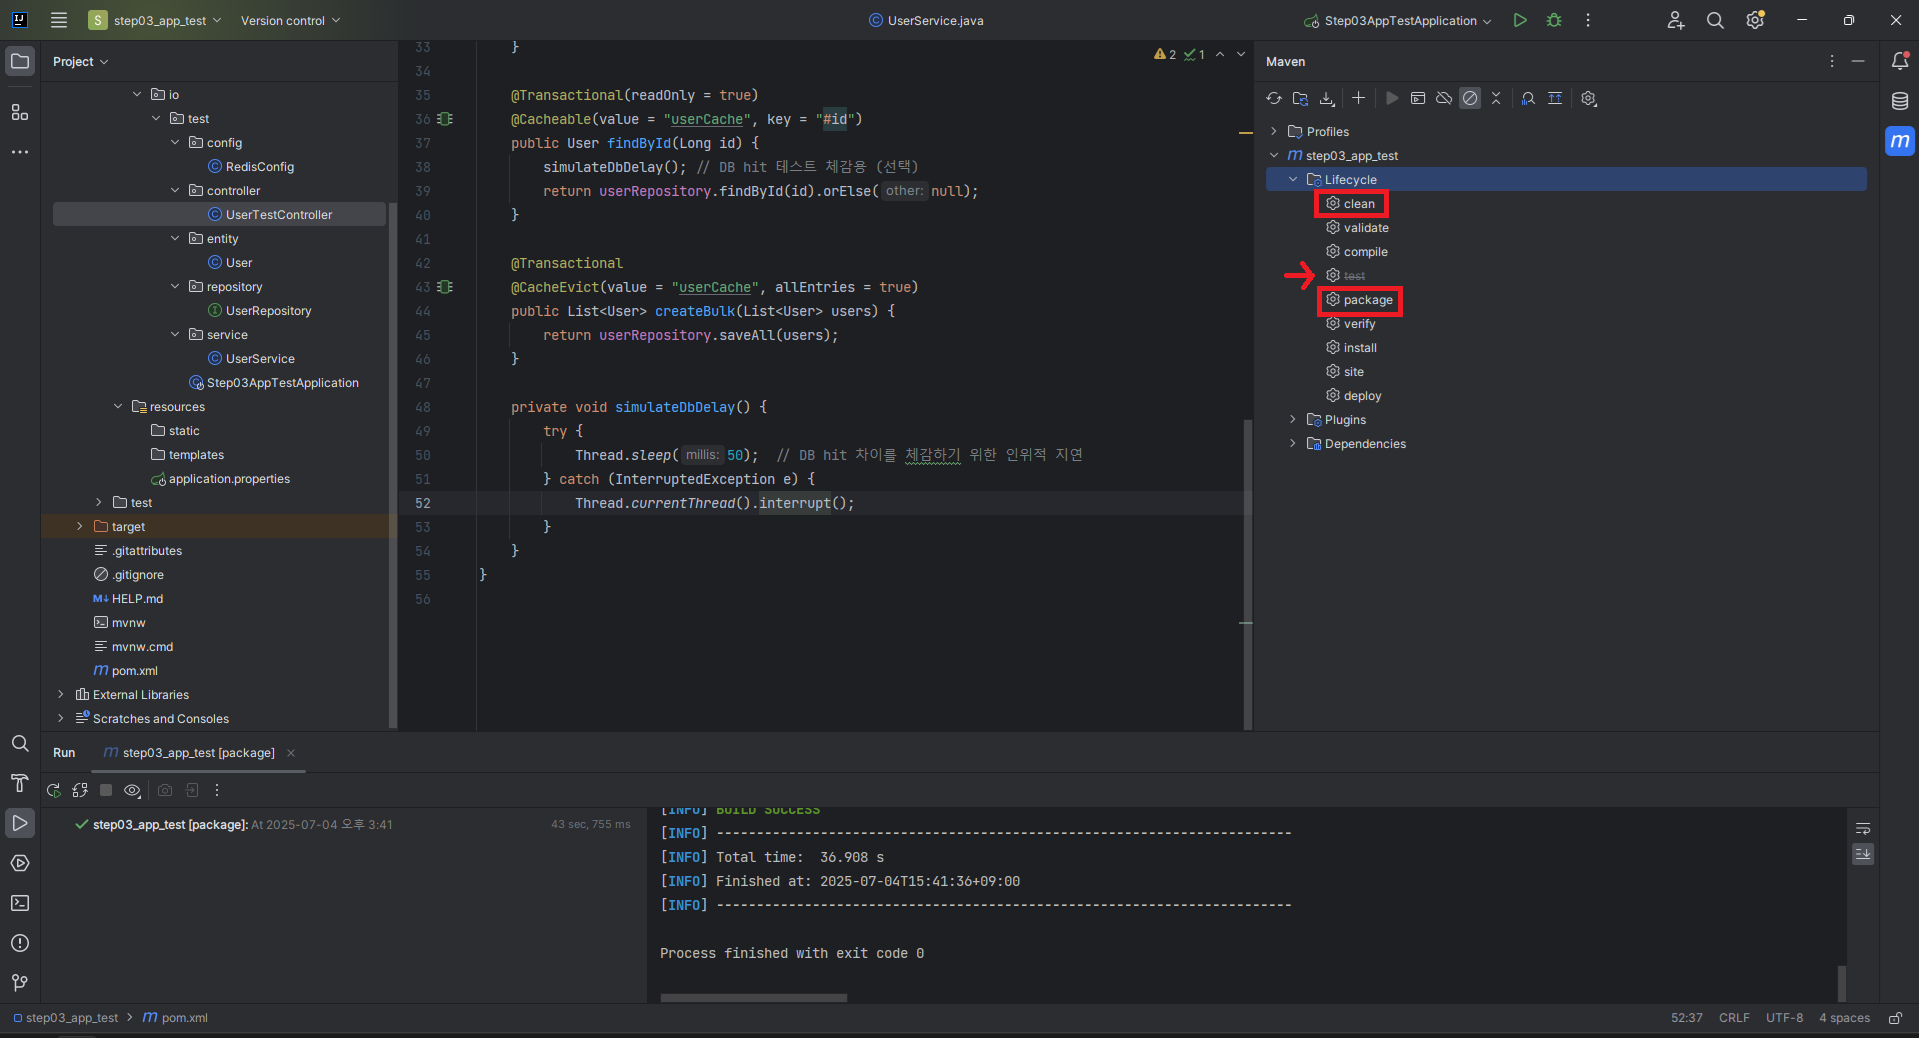
4.2. 애플리케이션 배포
[1] .jar 파일 패키징
[2] SFTP로 Ubuntu VM의 ~/k6 디렉터리에 .jar 파일 전송

[3] 백그라운드 실행
nohup java -jar step03_app_test-0.0.1-SNAPSHOT.jar &
[4] 실행 확인
netstat -nlpt | grep 8080
[5] 자바 로그 실시간 확인용 터미널 실행
tail -f nohup.out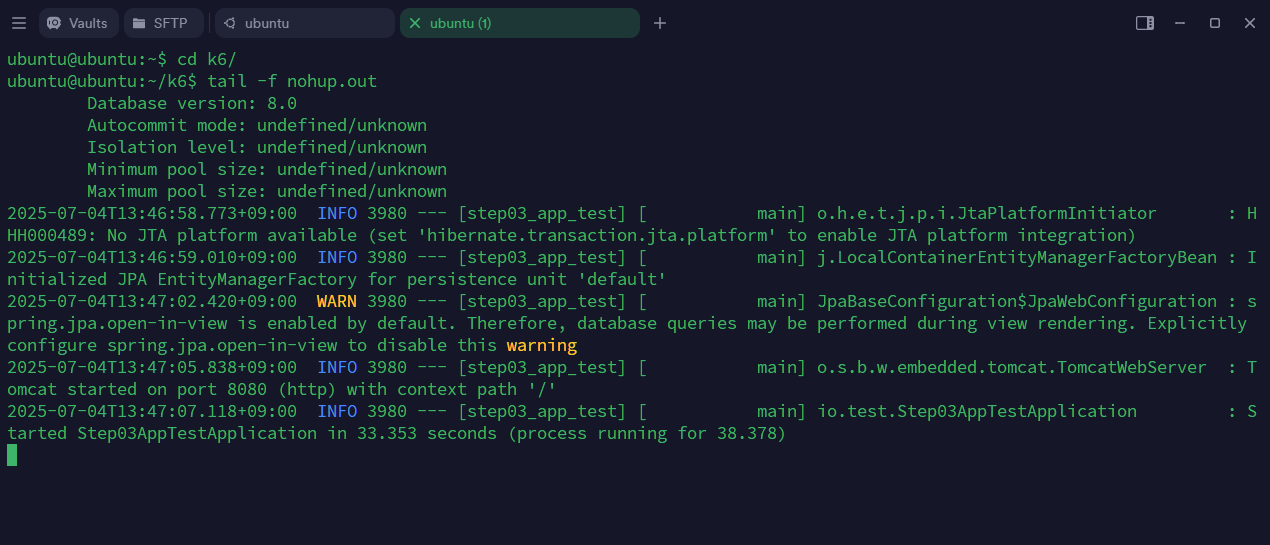
4.3. k6 스크립트 수정 (내부 네트워크로 변경)
get-user-script.js 파일을 복사하고, 내부 IP(127.0.0.1)로 접근할 수 있도록 수정한다. 이제 우분투 입장이라서 ip 주소를 127.0.0.1(private)으로 변경해야한다.
cp get-user-script.js  get-user-ubuntu-script.js
vi get-user-ubuntu-script.js
mport http from 'k6/http';
import { check, sleep } from 'k6';
// 테스트 설정
export let options = {
vus: 10, // 가상 사용자 수
duration: '30s', // 테스트 지속 시간
};
// 초기화 코드 (1회 실행)
export function setup() {
console.log('테스트 시작');
return { testData: 'some data' };
}
// 메인 테스트 함수 (각 VU가 반복 실행)
export default function (data) {
let response = http.get('http://127.0.0.1:8080/api/users/1');
check(response, {
'status is 200': (r) => r.status === 200,
'response time < 500ms': (r) => r.timings.duration < 500,
});
sleep(1);
}
// 정리 코드 (1회 실행)
export function teardown(data) {
console.log('테스트 종료');
}
4.4. vus 100으로 테스트 재시도
이전에 vus=100으로 실행했을 때는 네트워크 불안정으로 인해 거의 모든 요청이 실패했지만, 내부 실행 환경으로 변경한 후 다시 시도해보자.
k6 run --vus 100 --duration 30s get-user-ubuntu-script.js

ubuntu@ubuntu:~/k6$ k6 run --vus 100 --duration 30s get-user-ubuntu-script.js

         /\      Grafana   /‾‾/
    /\  /  \     |\  __   /  /
   /  \/    \    | |/ /  /   ‾‾\
  /          \   |   (  |  (‾)  |
 / __________ \  |_|\_\  \_____/

     execution: local
        script: get-user-ubuntu-script.js
        output: -

     scenarios: (100.00%) 1 scenario, 100 max VUs, 1m0s max duration (incl. graceful stop):
              * default: 100 looping VUs for 30s (gracefulStop: 30s)

INFO[0000] 테스트 시작                                        source=console
INFO[0031] 테스트 종료                                        source=console


  █ TOTAL RESULTS

    checks_total.......................: 4266   136.649821/s
    checks_succeeded...................: 87.41% 3729 out of 4266
    checks_failed......................: 12.58% 537 out of 4266

    ✓ status is 200
    ✗ response time < 500ms
      ↳  74% — ✓ 1596 / ✗ 537

    HTTP
    http_req_duration.......................................................: avg=391.24ms min=8.87ms med=269.03ms max=1.82s p(90)=835.77ms p(95)=1.28s
      { expected_response:true }............................................: avg=391.24ms min=8.87ms med=269.03ms max=1.82s p(90)=835.77ms p(95)=1.28s
    http_req_failed.........................................................: 0.00%  0 out of 2133
    http_reqs...............................................................: 2133   68.324911/s

    EXECUTION
    iteration_duration......................................................: avg=1.43s    min=1.01s  med=1.32s    max=2.96s p(90)=1.92s    p(95)=2.39s
    iterations..............................................................: 2133   68.324911/s
    vus.....................................................................: 33     min=33        max=100
    vus_max.................................................................: 100    min=100       max=100

    NETWORK
    data_received...........................................................: 388 kB 12 kB/s
    data_sent...............................................................: 173 kB 5.5 kB/s


running (0m31.2s), 000/100 VUs, 2133 complete and 0 interrupted iterations
같은 VM 내부에서 요청/응답이 이루어졌기 때문에, 네트워크 지연 없이 훨씬 안정적인 결과를 확인할 수 있다.
✅ 결론
서버와 k6를 동일한 환경(Ubuntu VM) 에서 실행함으로써 네트워크 레이어의 영향을 제거하고, 보다 신뢰도 높은 테스트 결과를 얻을 수 있게 되었다. 이전에는 vus=100에서 대규모 요청이 거의 실패했지만, 환경 개선 이후에는 안정적인 결과를 얻을 수 있었다. 더 좋은 성능을 위한 튜닝에 대해 알아보자.
'Test > k6' 카테고리의 다른 글
| [4] k6: 테스트 시각화(k6, InfluxDB, Grafana 대시보드 구축) (0) | 2025.12.13 |
|---|---|
| [3] k6: 성능 튜닝 가이드(DB, JVM, 그리고 Redis 캐시) (1) | 2025.12.13 |
| [1] k6: 성능 테스트 기초(테스트 이론과 k6 입문) (0) | 2025.07.04 |