
1. 들어가며
앞선 장들에서는 JPA의 연관 관계, 로딩 전략, 그리고 N+1 문제가 왜 발생하는지를 이론과 코드 예제를 통해 살펴보았다. 하지만 실제 현업에서 중요한 질문은 여기서 한 단계 더 나아간다. “그래서 이 문제를 어떻게 발견했고, 어떻게 개선했으며, 이 경험을 어떻게 설명할 수 있는가?” 이번 장에서는 N+1 문제를 실무 환경에서 모니터링하고 추적하는 방법, 그리고 그 경험을 설득력 있게 녹여내는 과정을 중심으로 이야기를 풀어보려 한다.
2. N+1 문제, 어떻게 모니터링할까?
실제 운영 중인 서비스에서는 수많은 API가 동시에 호출된다. 각 API는 서로 다른 비즈니스 로직을 가지고 있고, 그 내부에서는 여러 개의 SQL 쿼리가 실행된다. 문제는 이 쿼리들이 눈에 잘 보이지 않는다는 데 있다.
- API 하나가 SQL을 5개 실행하는지, 아니면 50개, 100개를 실행하는지 코드를 읽는 것만으로는 판단하기 어렵다.
- 특히 트래픽이 많은 서비스에서는 이런 “보이지 않는 쿼리”가 누적되며 심각한 병목을 만든다.
결국 서비스 전체의 안정성을 위해 실무자는 “어떤 API가 요청 1건당 몇 개의 SQL을 실행하고 있는가?”라는 질문에 답할 수 있어야 한다. 이를 위해 Hibernate가 실행하는 모든 SQL을 가로채서 기록하는 `StatementInspector`를 활용한다.
3. 핵심 개념: ThreadLocal
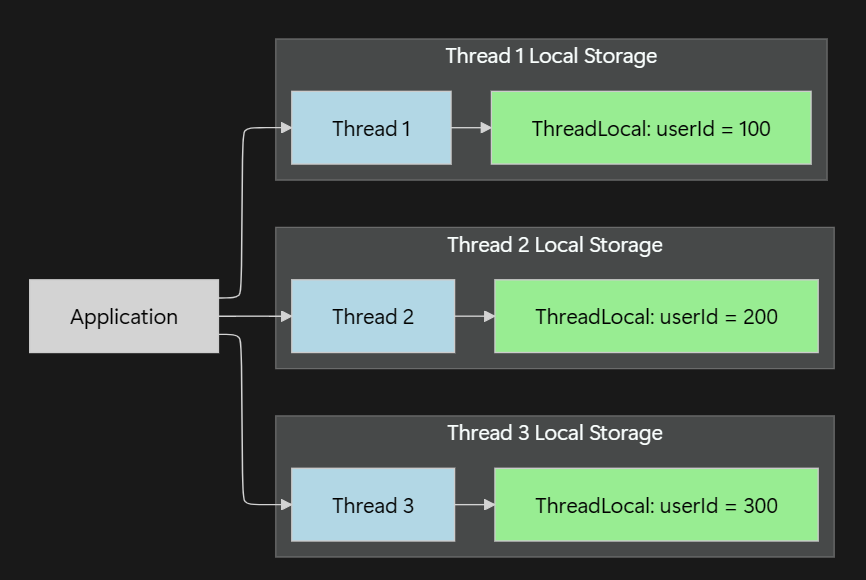
쿼리 모니터링 시스템을 구현하기 위해 반드시 이해해야 할 개념이 ThreadLocal이다. Spring MVC 기반의 웹 애플리케이션에서는 하나의 HTTP 요청이 하나의 스레드에서 처리된다.
ThreadLocal은 스레드마다 독립적인 저장 공간을 제공한다. 이를 통해 HTTP 요청 시작 시점에 전용 컨텍스트를 생성하고, 발생한 SQL을 누적한 뒤, 요청 종료 시점에 이를 기록하고 정리할 수 있다. 단, 스레드 풀 환경에서는 사용 후 반드시 remove()를 호출하여 데이터를 정리해야 한다.
구현 코드: RequestContext & Holder
@Getter
public class RequestContext {
    private String httpMethod;
    private String bestMatchPath;
    private final Map<QueryType, Integer> queryCountByType = new HashMap<>();

    @Builder
    public RequestContext(String httpMethod, String bestMatchPath) {
        this.httpMethod = httpMethod;
        this.bestMatchPath = bestMatchPath;
    }

    public void incrementQueryCount(String sql) {
        QueryType queryType = QueryType.from(sql); // SQL 첫 단어로 타입 구분
        queryCountByType.merge(queryType, 1, Integer::sum);
    }
}
public class RequestContextHolder {
private static final ThreadLocal<RequestContext> CONTEXT = new ThreadLocal<>();
public static void initContext(RequestContext context) {
CONTEXT.remove();
CONTEXT.set(context);
}
public static RequestContext getContext() {
return CONTEXT.get();
}
public static void clear() {
CONTEXT.remove();
}
}4. 흐름 제어: HandlerInterceptor
Spring의 HandlerInterceptor를 사용해 요청의 시작과 끝을 가로챈다. 여기서 중요한 포인트는 URI 자체가 아닌 URI 패턴을 기준으로 집계한다는 점이다. /api/users/1과 /api/users/2를 각각 집계하면 데이터가 파편화되므로, BEST_MATCHING_PATTERN_ATTRIBUTE를 활용해 /api/users/{id} 단위로 묶어 관리한다.
@Component
@RequiredArgsConstructor
public class QueryCountInterceptor implements HandlerInterceptor {
    private final MeterRegistry meterRegistry;
    public static final String UNKNOWN_PATH = "UNKNOWN_PATH";

    @Override
    public boolean preHandle(HttpServletRequest request, HttpServletResponse response, Object handler) {
        String httpMethod = request.getMethod();
        String bestMatchPath = (String) request.getAttribute(HandlerMapping.BEST_MATCHING_PATTERN_ATTRIBUTE);

        RequestContext ctx = RequestContext.builder()
                .httpMethod(httpMethod)
                .bestMatchPath(bestMatchPath != null ? bestMatchPath : UNKNOWN_PATH)
                .build();

        RequestContextHolder.initContext(ctx);
        return true;
    }

    @Override
    public void afterCompletion(HttpServletRequest request, HttpServletResponse response, Object handler, Exception ex) {
        RequestContext ctx = RequestContextHolder.getContext();
        if (ctx != null) {
            ctx.getQueryCountByType().forEach((type, count) -> recordMetrics(ctx, type, count));
        }
        RequestContextHolder.clear();
    }

    private void recordMetrics(RequestContext ctx, QueryType queryType, Integer count) {
        DistributionSummary.builder("app.query.per_request")
                .tag("path", ctx.getBestMatchPath())
                .tag("http_method", ctx.getHttpMethod())
                .tag("query_type", queryType.name())
                .publishPercentiles(0.5, 0.95)
                .register(meterRegistry)
                .record(count);
    }
}
5. 쿼리 가로채기: StatementInspector
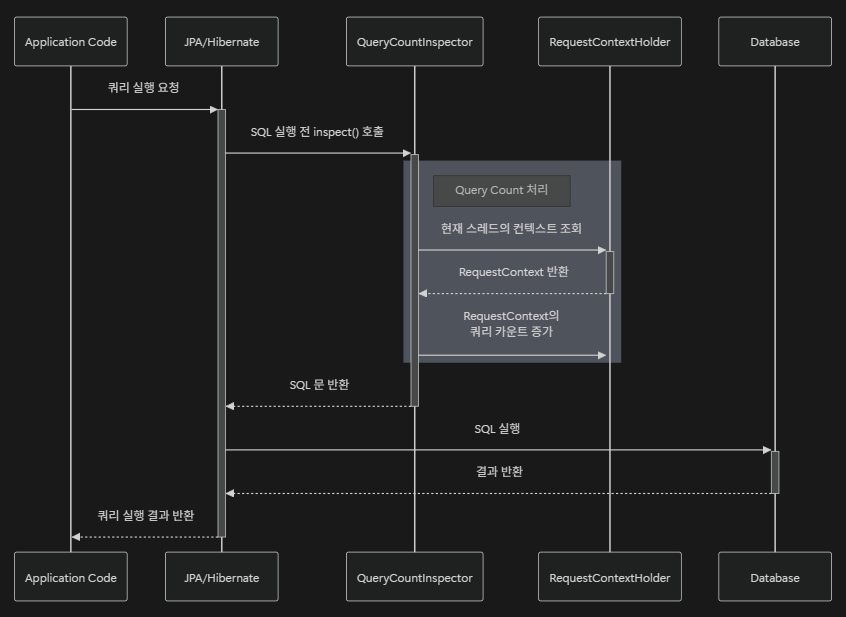
가장 핵심적인 부분이다. Hibernate는 SQL을 실제로 실행하기 직전에 inspect() 메서드를 호출한다. 동작에는 영향을 주지 않으면서 SQL을 관찰하여 카운트를 증가시킨다.
구현 코드 및 설정
public class QueryCountInspector implements StatementInspector {
    @Override
    public String inspect(String sql) {
        RequestContext ctx = RequestContextHolder.getContext();
        if (ctx != null) {
            ctx.incrementQueryCount(sql);
        }
        return sql;
    }
}
application.yml 설정
spring:
  jpa:
    properties:
      hibernate:
        session_factory:
          # 실제 패키지 경로를 포함한 클래스명을 작성한다
          statement_inspector: ding.co.backendportfolio.chapter5.config.QueryCountInspector
6. 시각화: Grafana Dashboard
수집된 메트릭은 Grafana를 통해 시각화된다. 아래의 JSON 설정을 통해 API별 쿼리 수의 추이와 P95(상위 5% 소요 시간) 지표를 한눈에 확인할 수 있다.
> dashboard.json (핵심 패널 구성)
{
"annotations": {
"list": [
{
"builtIn": 1,
"datasource": {
"type": "grafana",
"uid": "-- Grafana --"
},
"enable": true,
"hide": true,
"iconColor": "rgba(0, 211, 255, 1)",
"name": "Annotations & Alerts",
"type": "dashboard"
}
]
},
"editable": true,
"fiscalYearStartMonth": 0,
"graphTooltip": 0,
"id": 1,
"links": [],
"panels": [
{
"datasource": {
"type": "prometheus",
"uid": "dec2qjm357jlsc"
},
"fieldConfig": {
"defaults": {
"color": {
"mode": "palette-classic"
},
"custom": {
"axisBorderShow": false,
"axisCenteredZero": false,
"axisColorMode": "text",
"axisLabel": "",
"axisPlacement": "auto",
"barAlignment": 0,
"barWidthFactor": 0.6,
"drawStyle": "line",
"fillOpacity": 0,
"gradientMode": "none",
"hideFrom": {
"legend": false,
"tooltip": false,
"viz": false
},
"insertNulls": false,
"lineInterpolation": "linear",
"lineWidth": 1,
"pointSize": 5,
"scaleDistribution": {
"type": "linear"
},
"showPoints": "auto",
"spanNulls": false,
"stacking": {
"group": "A",
"mode": "none"
},
"thresholdsStyle": {
"mode": "off"
}
},
"mappings": [],
"thresholds": {
"mode": "absolute",
"steps": [
{
"color": "green",
"value": null
}
]
},
"unit": "none"
},
"overrides": []
},
"gridPos": {
"h": 14,
"w": 9,
"x": 0,
"y": 0
},
"id": 1,
"options": {
"legend": {
"calcs": [
"min",
"mean",
"max",
"lastNotNull"
],
"displayMode": "table",
"placement": "bottom",
"showLegend": true,
"sortBy": "Last *",
"sortDesc": true
},
"tooltip": {
"hideZeros": false,
"mode": "single",
"sort": "none"
}
},
"pluginVersion": "11.5.1",
"targets": [
{
"datasource": {
"type": "prometheus",
"uid": "dec2qjm357jlsc"
},
"editorMode": "code",
"expr": "(\n (\n sum by (http_method, path, query_type) (\n increase(app_query_per_request_sum[30s])\n )\n )\n /\n (\n sum by (http_method, path, query_type) (\n increase(app_query_per_request_count[30s])\n )\n )\n)\nUNLESS\n(\n sum by (http_method, path, query_type) (\n increase(app_query_per_request_count[30s])\n )\n == 0\n)\n",
"instant": false,
"legendFormat": "{{http_method}} {{path}} - {{query_type}}",
"range": true,
"refId": "A"
}
],
"title": "API - Query Count [30s]",
"type": "timeseries"
},
{
"datasource": {
"type": "prometheus",
"uid": "dec2qjm357jlsc"
},
"fieldConfig": {
"defaults": {
"color": {
"mode": "palette-classic"
},
"custom": {
"axisBorderShow": false,
"axisCenteredZero": false,
"axisColorMode": "text",
"axisLabel": "",
"axisPlacement": "auto",
"barAlignment": 0,
"barWidthFactor": 0.6,
"drawStyle": "line",
"fillOpacity": 0,
"gradientMode": "none",
"hideFrom": {
"legend": false,
"tooltip": false,
"viz": false
},
"insertNulls": false,
"lineInterpolation": "linear",
"lineWidth": 1,
"pointSize": 5,
"scaleDistribution": {
"type": "linear"
},
"showPoints": "auto",
"spanNulls": false,
"stacking": {
"group": "A",
"mode": "none"
},
"thresholdsStyle": {
"mode": "off"
}
},
"mappings": [],
"thresholds": {
"mode": "absolute",
"steps": [
{
"color": "green",
"value": null
}
]
},
"unit": "none"
},
"overrides": []
},
"gridPos": {
"h": 14,
"w": 9,
"x": 9,
"y": 0
},
"id": 2,
"options": {
"legend": {
"calcs": [
"min",
"max",
"lastNotNull"
],
"displayMode": "table",
"placement": "bottom",
"showLegend": true,
"sortBy": "Last *",
"sortDesc": true
},
"tooltip": {
"hideZeros": false,
"mode": "single",
"sort": "none"
}
},
"pluginVersion": "11.5.1",
"targets": [
{
"datasource": {
"type": "prometheus",
"uid": "dec2qjm357jlsc"
},
"disableTextWrap": false,
"editorMode": "code",
"expr": "max by(http_method, path, query_type) (app_query_per_request{quantile=\"0.95\"})",
"fullMetaSearch": false,
"includeNullMetadata": true,
"instant": false,
"legendFormat": "P95 - {{http_method}} {{path}} - {{query_type}}",
"range": true,
"refId": "A",
"useBackend": false
},
{
"datasource": {
"type": "prometheus",
"uid": "dec2qjm357jlsc"
},
"editorMode": "code",
"expr": "max by(http_method, path, query_type) (app_query_per_request{quantile=\"0.50\"})",
"hide": false,
"instant": false,
"legendFormat": "P50 - {{http_method}} {{path}} - {{query_type}}",
"range": true,
"refId": "B"
}
],
"title": "API - Query Count percentile",
"type": "timeseries"
}
],
"preload": false,
"refresh": "",
"schemaVersion": 40,
"tags": [],
"templating": {
"list": []
},
"time": {
"from": "now-30m",
"to": "now"
},
"timepicker": {},
"timezone": "browser",
"title": "New dashboard",
"uid": "cec2z7cap8idcb",
"version": 5,
"weekStart": ""
}
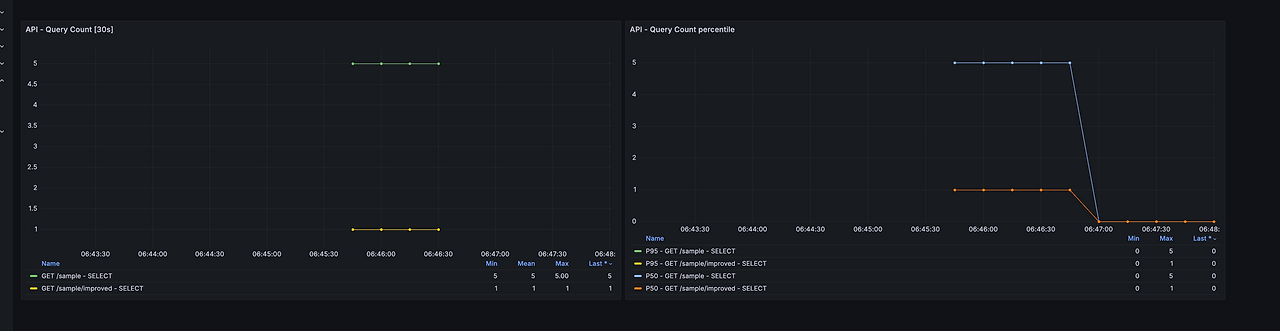
이제 숫자로만 쌓이던 데이터를 눈으로 볼 차례다. Prometheus에 수집된 메트릭을 Grafana로 시각화하면 다음과 같은 장면을 마주하게 된다.
- 특정 API만 유독 쿼리 수가 높은 그래프
- p95 기준으로 급격히 튀는 요청 패턴
- 배포 이후 쿼리 수가 급증한 시점
이 순간부터 N+1 문제는 더 이상 “추측”이 아니다. 명확한 지표를 가진 개선 대상이 된다. “이 API는 요청 1건당 평균 60개의 SELECT를 실행하고 있습니다.” 이 한 문장은, 어떤 설계 리뷰보다 강력하다.
'Spring > JPA' 카테고리의 다른 글
| [Optimization-6] JPA: 벌크 연산과 성능 최적화 (0) | 2025.12.27 |
|---|---|
| [Optimization-5] JPA: 벌크 연산의 이해와 ID 생성 전략의 상관관계 (0) | 2025.12.26 |
| [Optimization-3] N+1 문제 - 대표적인 사례와 해결 전략 (0) | 2025.12.26 |
| [Optimization-2] 기초(2) - 성능 최적화의 열쇠, 프록시와 로딩 전략 (0) | 2025.12.26 |
| [Optimization-1] 기초(1) - 현대 백엔드 개발의 표준, JPA의 본질 (0) | 2025.12.26 |